I love RStudio. It’s great. I didn’t really appreciate how great it was when I was just using RStudio to be honest, but when I started using Python more I missed some of its features a lot. About a year later, I’ve finally managed to (almost) duplicate its data focused interactive workflow in a well maintained IDE. That IDE is Atom
What exactly do I mean by RStudio (sort of)?
- [ ] Select code in a script and run it with Ctrl + Enter or equivalent
- [ ] Interact with a console that shares the same environment as the one where
your code is executed from the script
- [ ] Have a window dedicated to outputs like plots
- [ ] Have a window dedicated to help files/ docstrings
- [ ] Have a window showing the variables currently defined in the environment
Get set up
- Install Atom
- Install Anaconda and create a conda environment with carefully managed packages
- Open Anaconda Prompt or your Terminal
- Activate the conda environment you’re after
- Install jupyter_console:
bash conda install -c conda-forge jupyter_console - Open atom from the command line:
bash
atom --new-instance
This ensures that Atom refers to the Python interpreter and packages appropriate for that environment.
Install Atom packages
You will need the following atom packages:
-
Hydrogen connects your instance of Atom to an instance of the Jupyter kernel found in your current environment
Set up Atom
As far as I can tell you might have to do this everytime you start up Atom, which is a major bummer but it’s also the reason why I’m recording all the steps here.
- Open your python script that handles the data and stuff
Highlight a few lines of text and press
Ctrl + EnterThis initiates the connection with the iPython Kernel through Hydrogen
Press
⌘ + Shift + P/Ctrl + Shift + Pand type in ‘Launch’Select “Launch Jupyter Console In Platformio Terminal”
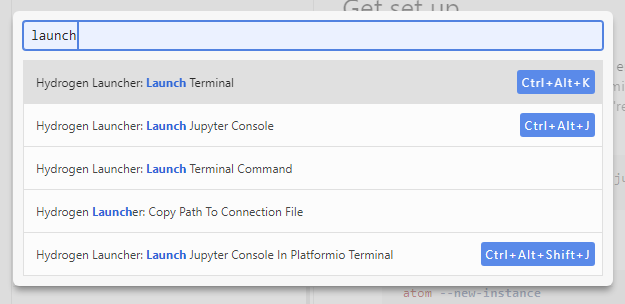
This will create an interactive iPython console in a terminal window in Atom,
most importantly though, it’s same Kernel used by Hydrogen when you execute code
from your script
Click on a function call in your script and press
alt + IThis will open up its docstring in a new window.
Press
Ctrl + Shift + P, type in ‘watch’, and select “Hydrogen: Add Watch”This will open a window where you can track various expressions. More info here
In the top “Watch”, type in
%whosThis is a jupyter notebooks command that shows you a list of defined variables. The nifty thing here is that the “Watch” window updates every time you execute code, so it’ll stay up to date without you having to take too much action. The downside is that it’s still pretty messy compared to the “Environment” window in RStudio.
Press
Ctrl + Shift + Pone more time and type in ‘output’, select “Hydrogen: Toggle Output Area”This is not quite as fully featured as the RStudio plot viewer but it does at least tidy up your workspace by putting all the outputs of your script in one place.
Wrapping up
Now that you’ve got a million windows open, drag them into your preferred groups. I went straight for: * Script in top left * console/terminal bottom left * Watch/Variable list and Git in top right * Inspector (Help), Project (eqivalent of Files), and Output (Plot - ish) in bottom right
It’s not perfect but it’s pretty good, and Atom has some pretty nice features of its own, so I probably won’t always use it in this configuration, but it’s good to have it there when I need it ;)
PS - Going the other way with reticulate
What if I told you you don’t need to create a fake RStudio setup to run Python?
I’m pretty excited about reticulate, but I haven’t had time to create a good workflow with it yet. Soon though, soon 😎
🐒